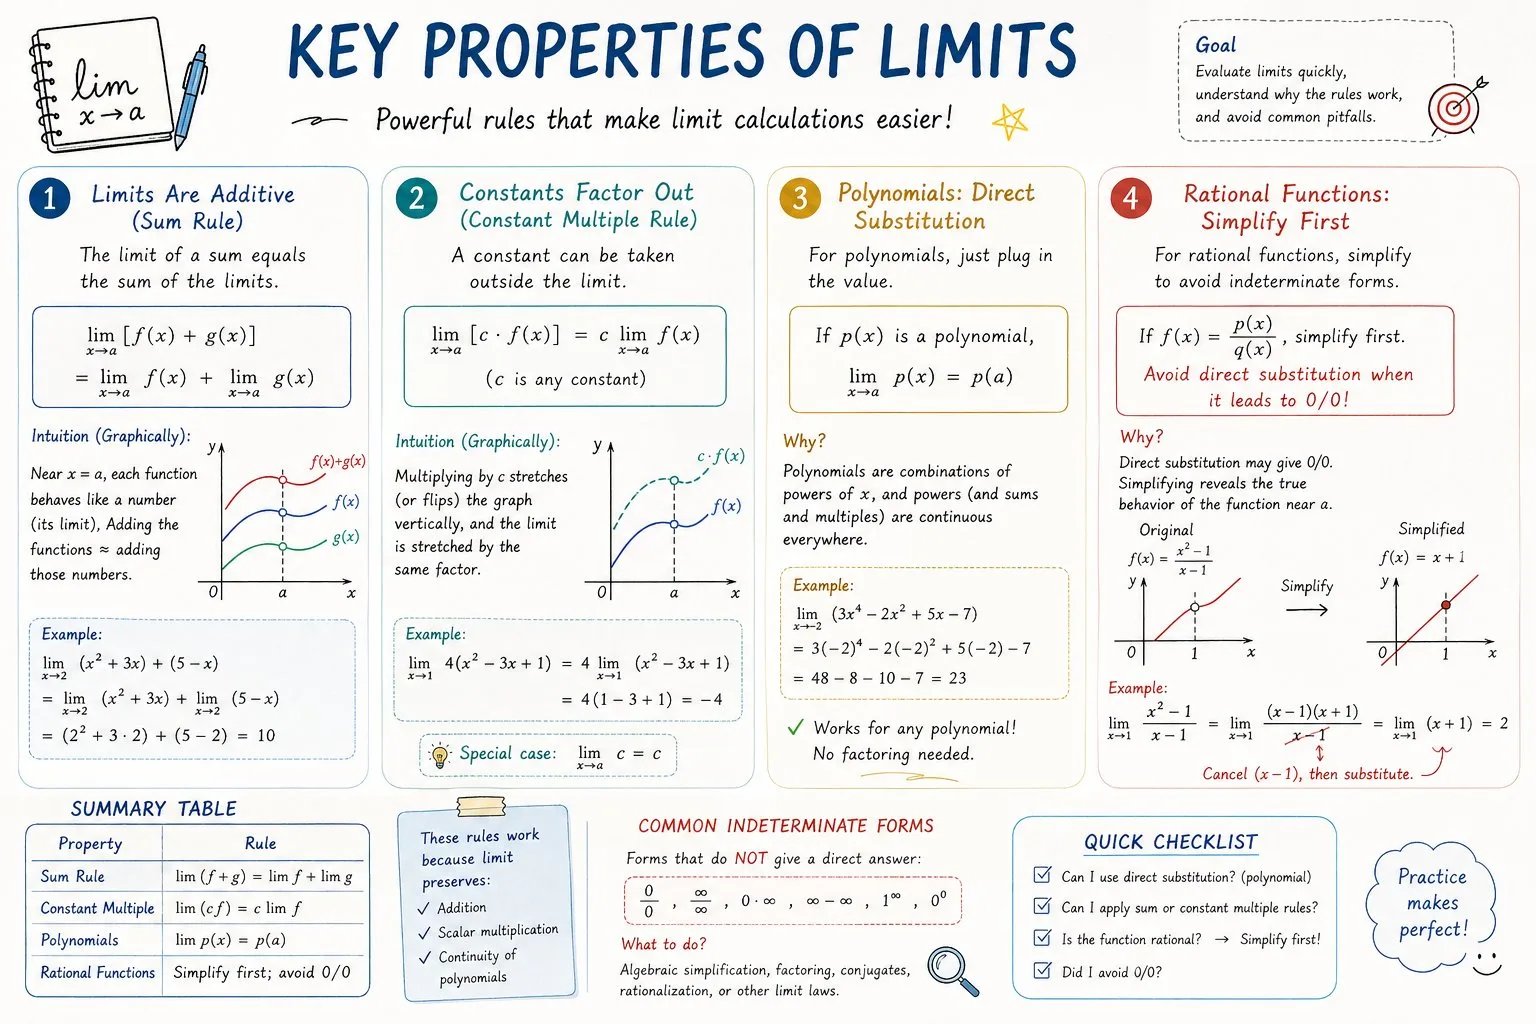
Mathematical Visualization Infographic Template
提示词
Please create a mathematical visualization infographic about "[math concept / topic]." The goal is to help the viewer intuitively understand what it is, why it works, its geometric or structural intuition, and how it behaves in different contexts. The visual should feel like a high-quality math lecture handout combined with a hand-drawn educational poster. It should be elegant, clear, and information-rich, but not cluttered. Visual style: either portrait or landscape is fine. Use a clean, light paper-like background, with a deep blue title and black or dark gray lines for the main content. Add a small number of refined accent colors such as blue, teal, gold, and red. Incorporate rounded-corner cards, thin borders, numbered labels, hand-drawn arrows, zoom-in callout boxes, and a summary section. The overall design should be aesthetically pleasing, balanced, and academic, allowing the viewer to grasp the structure of the concept and why it works at a glance.
已有 23 人用过这个提示词
- 尺寸
- 1536 × 1024
Mathematical Visualization Infographic Template
An elegant, high-quality educational infographic template designed for mathematical concepts. Featuring a clean, light paper-like background, this layout incorporates hand-drawn elements, numbered labels, and zoom-in callout boxes. The design uses a sophisticated color palette of deep blue, teal, gold, and red to highlight structural intuition. Perfect for academic handouts or posters, it balances clarity and aesthetic appeal to make complex mathematical theories intuitive and easy to understand at a glance.
相似作品
返回图片社区
Adidas Aeroblade X Futuristic Sneaker Campaign Poster

Serene Portrait of Woman in Floral Headscarf

Portrait of a Young Woman in White Shirt

Step Into Air Premium Summer Clog Campaign

Neon Green Volt Rush Energy Drink Splash

Ethereal Woman in Red Amidst Red Spider Lilies

Battle Sister Rising Amidst Ruins

Woman Enjoying Crispy Fried Chicken
做出了满意的作品?
把你的作品分享到图片社区。分享的图片会永久保存,发布后还能获得积分奖励。